Engaging locals and stakeholders in the cocreation of successful land use policies is at the core of the ArcticHubs project, funded by Horizon Europe. Maptionnaire is proud that its PPGIS solution for community engagement helps researchers and practitioners in this mission — you can learn more about Maptionnaire’s role in ArcticHubs here.
This time, we explore how PPGIS is used in Varangerfjord — the northernmost part of Norway. Mr. Roy Robertsen, a senior scientist at Nofima, leads the work at the Varangerfjord hub, focusing on the effects of aquaculture, fish farming, and tourism on the environment.
In this interview, Roy recaps the hub’s first PPGIS study and estimates whether a community engagement tool like Maptionnaire can be used for studying SLO (Social License to Operate) and preparing coastal zoning plans.
Varangerfjord in the ArcticHubs
Similarly to many other areas of the Arctic region, industrial fish farming and aquaculture are new to northern Norway — they were first introduced in the early 2000s. And yet the effects of this production on local land use, sustainability, and traditional economic activities are dramatic.
The conflicts studied at Varangerfjord are quite similar to those on the Faroe Islands, where new forms of fish farming displace traditional activities. At the same time, these industries bring new revenue and employment opportunities. To understand how residents of the Varangerfjord area relate to these changes, the hub set up a Maptionnaire survey to capture the locals’ values and opinions.

A PPGIS Study to Uncover Local Preferences
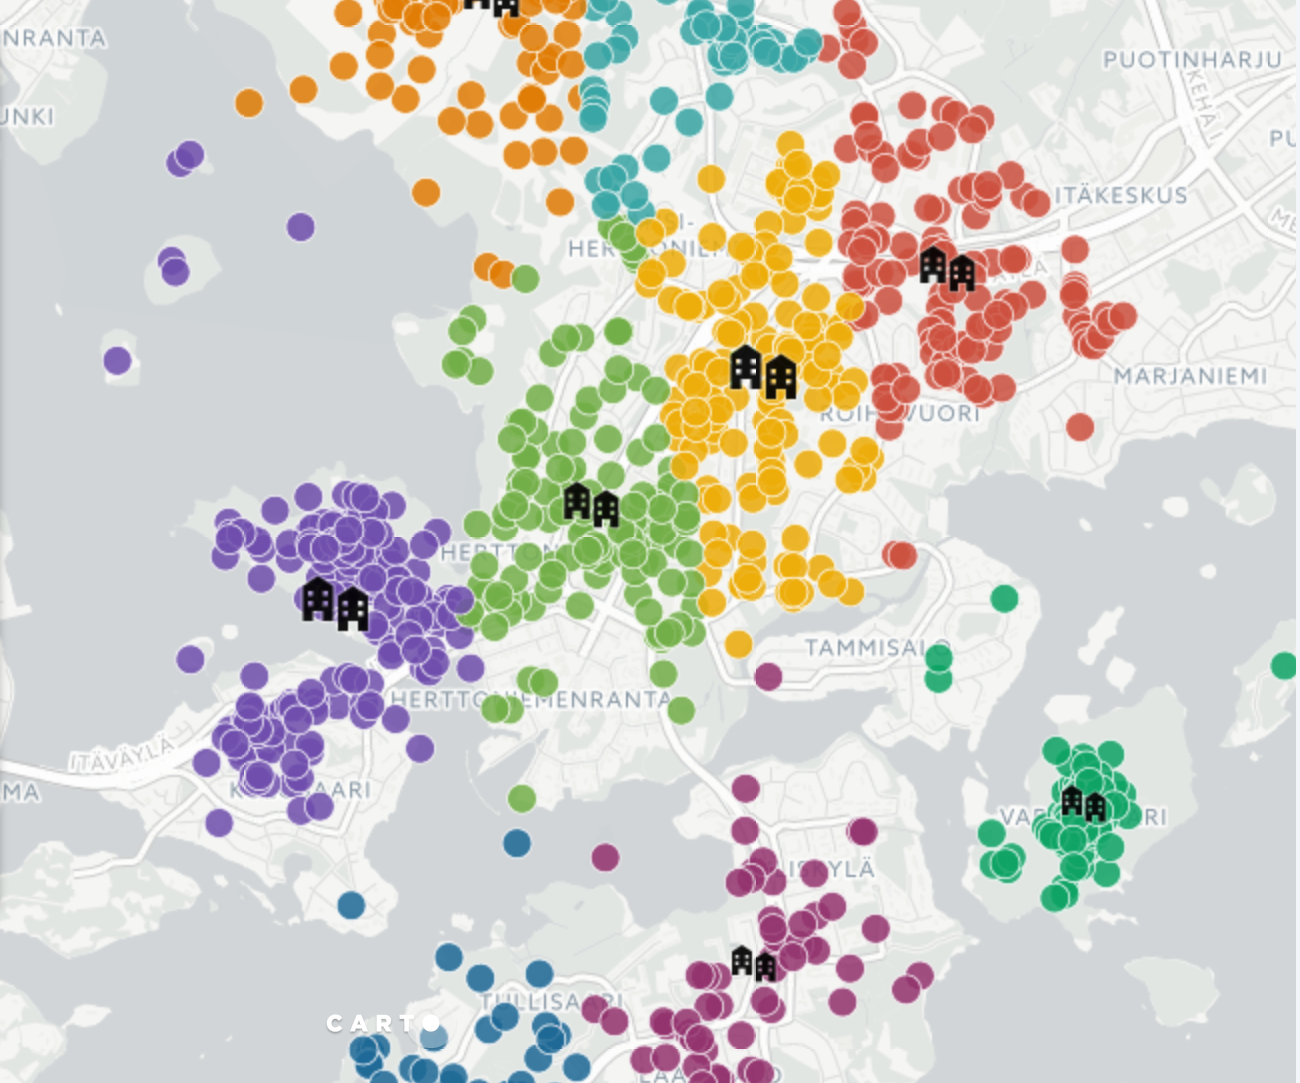
The Varangerfjord hub used an online PPGIS survey for studying how locals perceive the changes caused by aquaculture, tourism, and industrial fishing. In the ArcticHubs project, researchers use Maptionnaire for surveying opinions about land and resource use, and the platform works well for collecting this type of spatial information.
Looking back at the similar PPGIS studies done in Westfjord and Suðuroy hubs, the researchers intentionally kept the survey short and simple. In this survey, respondents could mark an area or a point on a map and comment on the pros and cons of industrial activities in that area, having to answer about 7-8 questions about each industry.
Overall, about 400 residents answered the survey — for an area with 20,000 inhabitants, it’s a satisfactory response rate. Researchers got a wealth of geolocated data about places where the new industries cause conflicts — the places people love or perceive as not suitable for tourism or industrial activities. At the same time, respondents gave a lot of open answers that were quite an interesting read. Overall, the survey results indicate that the locals are more favorable to fishing activities than aquaculture.

Outreach strategy is a key to valuable data
As the survey was spread through a Facebook campaign, the researchers noticed that it could have caused snowball sampling — the link is shared among people with similar opinions, also due to Facebook’s algorithm. All this could make the results unrepresentative of most inhabitants’ opinions. To test if this is true or not, the Varangerfjord hub will organize an additional survey with a panel company that ensures a diverse sample of respondents. In this survey, they’ll ask the same questions and compare the results — this study will help to validate the results of the first PPGIS study.
But the snowball sampling is not innate to the PPGIS tool but to the outreach strategy. An optimal strategy should combine multiple channels — because relying on only one media (like Facebook) could create this chain of sharing among like-minded people.
From Maptionniare’s practice, networking with local groups and NGOs proved to be beneficial, as well as using various social media channels and even drawing attention to the survey in the physical environment itself (as, for example, the City of Tallinn did).
Read more about the best practices of planning an outreach strategy for your survey and other participation activities among residents and stakeholders in this guide.


Studying Social License to Operate with PPGIS
For the next step, Roy Robertsen considers if he can use Maptionnaire’s PPGIS functionalities for getting data regarding the Social License to Operate (SLO) concept.
Social License to Operate relates to the acceptance of the industry’s business practices by the locals and stakeholders. The concept has its origins in the mining industry in Australia, and nowadays it’s also used in other countries, for example, in Finland. In Norway, however, it has not been used much so far, especially when it comes to fishing and aquaculture industries.
Nofima pioneered it in this respect by running a SLO survey about the social acceptance of aquaculture in two other Norwegian counties — Tromso and Vestland. The researchers tested a traditional SLO analysis model initially created for mining activities and eventually had to adjust it to fit the aquaculture industry. Using PPGIS for such an analysis would open new possibilities, also for other members of the ArcticHubs.

PPGIS in the Toolbox for Researchers and Planners
Apart from SLO, Roy sees one more lucrative application of PPGIS in the Arctics — informing intermunicipal coastal zone planning. It’s essential to listen to people’s opinions in these processes since new industries, on the one hand, threaten traditional economic activities and damage the environment, and, on the other, create new job opportunities and growth. To devise a sustainable solution, it is essential to know what social and economic values are attached to each location and what locals think about these conflicts.
Actually, these coastal zoning planning activities already have an element of public engagement. But planners only hear from a few loud voices who care enough to come to in-person meetings or write angry letters. Digital engagement tools like Maptionnaire democratize the process and increase the outreach. PPGIS helps planners to listen to many different people and get valuable, geo-located information about their experiences.
Overall, Roy hopes that Maptionnaire will be useful for researchers and planners also outside the ArcticHubs project. In Nofima, they’ll try to maintain PPGIS as a regular part of their toolbox.
Curious for more? Here you can read more about the hub at Varangerfjord and Roy Robertsen’s studies of aquaculture in the Arctic region.


.webp)

.jpeg)
-min.jpeg)
.jpg)


.jpeg)


.jpeg)


.jpeg)


.jpeg)
.jpeg)
.jpeg)


.jpeg)