When trying to engage stakeholders and residents in participatory planning, you’re essentially competing against other things that your potential respondent would rather be doing, such as liking things on Facebook or pinning latest trends on Pinterest. Answering a map survey is probably not high on their agenda!
But can you make an interactive map survey that will better engage respondents in participatory planning? Sure, with Maptionnaire’s interactive mapping features it’s quite easy. Here are the steps:
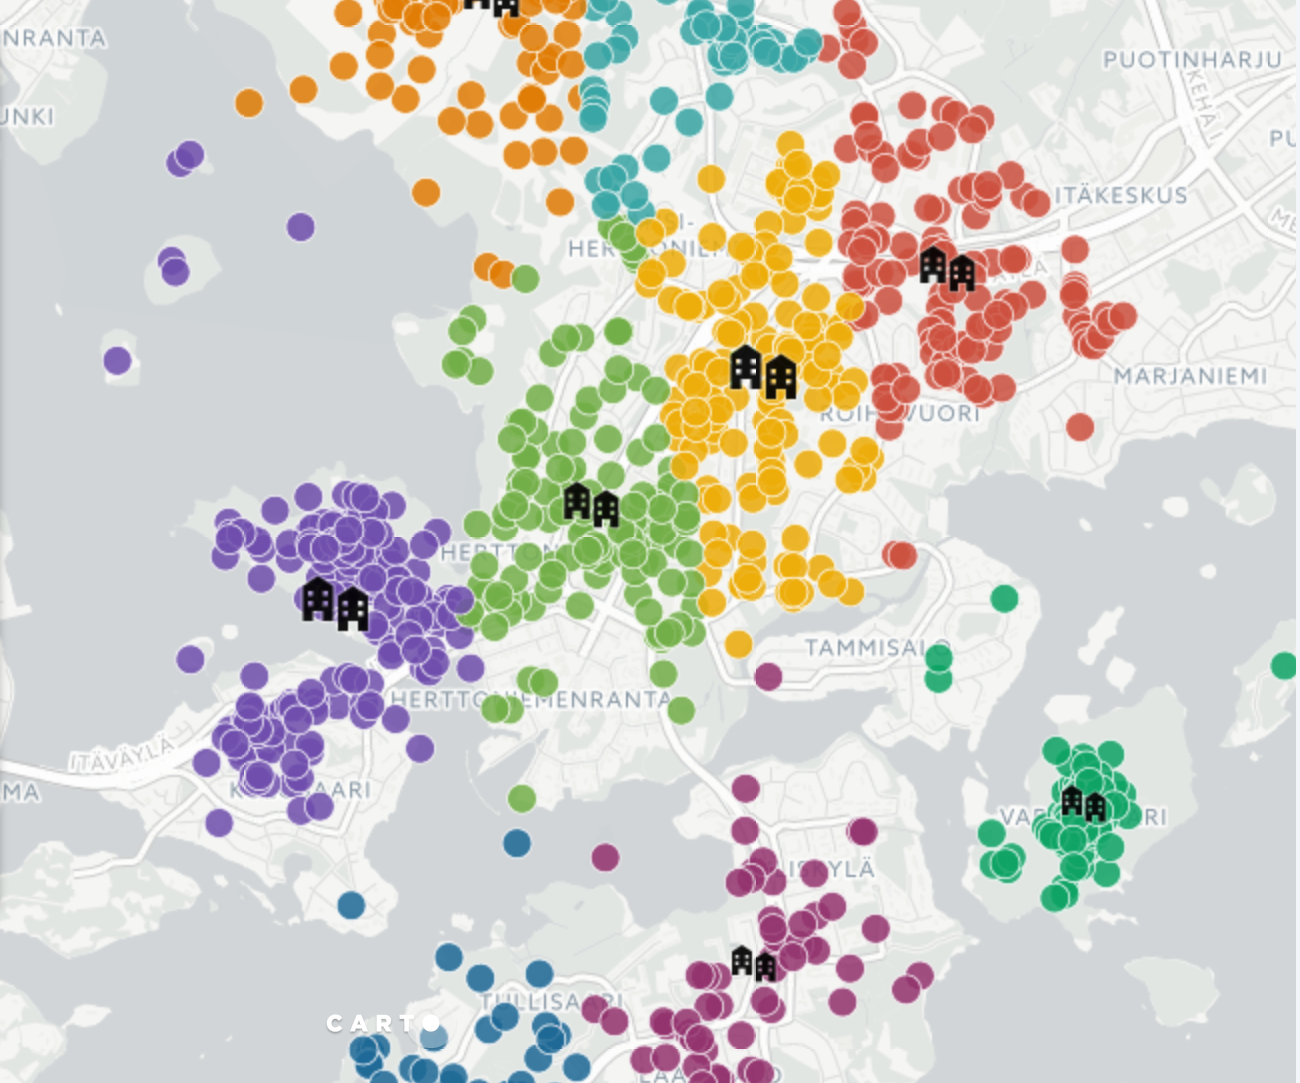
1. Customize Your Map Survey
Use your own colors, images, and icons to customize the questionnaire. You can add a lot of visual swoon to your survey just by adding some of your own visual materials. These visuals can include logos, project visuals, specific colors for your draw-buttons, headings, and other questionnaire elements.
Maptionnaire allows you to add small informative icons to the pins you ask people to put on the map. It is worth inspecting the ever-growing selection of different icons available!

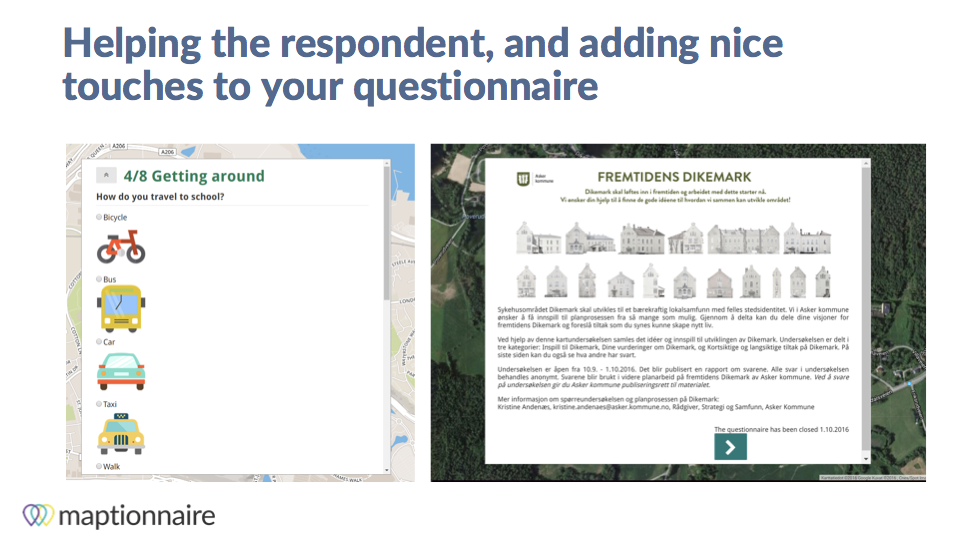
2. Add Visual Elements
Add other visual elements that make the questionnaire look nicer — here we discuss in a bit more detail how you can create a visual survey for urban planning.
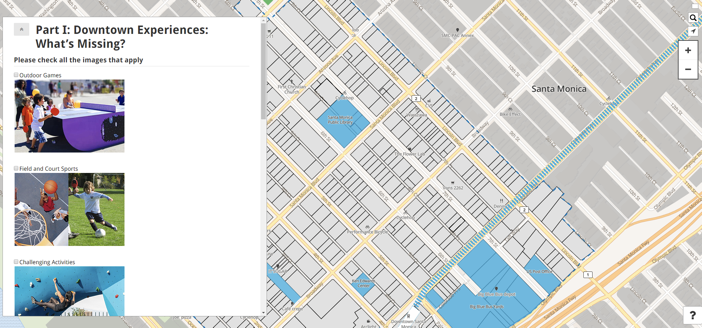
Adding small pictograms or figures to your multiple selection questions can make help respondents answer the questions better. Besides, they can help with necessary clarifications to different answer options.
You can also hide the questionnaire heading on the front page and replace it with an image containing the questionnaire name and other cool graphical elements, as has been done in a project discussing the repurposing of an old mental hospital area in Dikemark, Norway from the picture below.
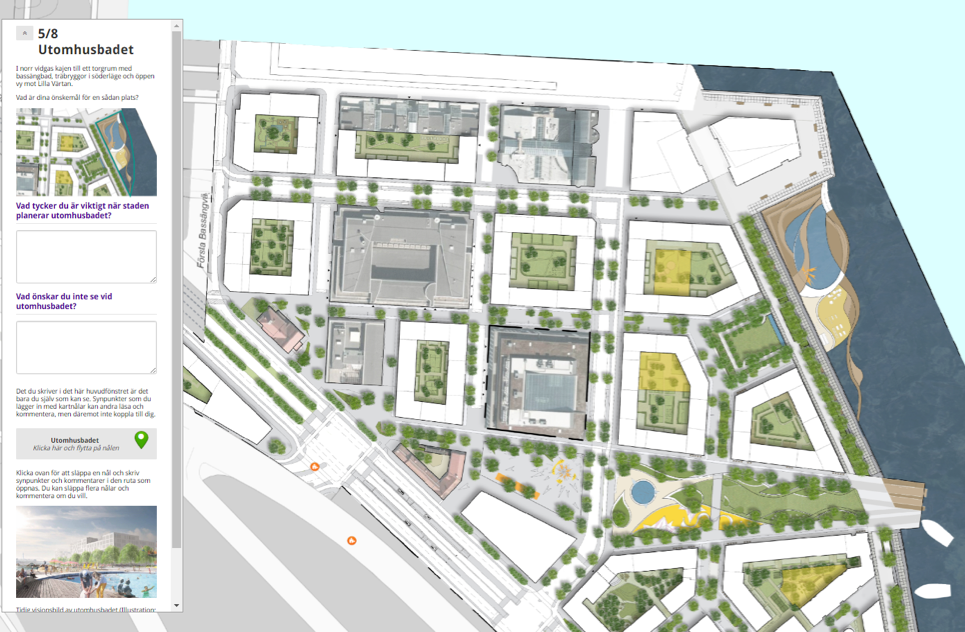
3. Add Map Overlays
Add other visual elements that help the respondent. Adding map overlays that portray the current or future situation at your survey location can also help a whole deal. Below is an example using customized Leaflet-layers on top of the regular base map, but also Geotiffs and Shapefiles work great for this.
Did you know that it has been proven that map-based surveys are exceptionally valuable for public participation in urban planning?
4. Add a Storyline & Guide
Add a storyline and guide your respondent through the survey. You can dictate the location of the map page by page, or guide the map location based on user responses. Walking the respondents through the project area and drawing their attention to one detail at a time can be a great way of helping the respondent concentrate in one theme at a time.
Besides these main points, there is plenty you can do to make the participatory planning process a better experience for the respondents. Some of our partners give prices for people who fill out the questionnaires in different forms, such as gifts for example. Here are more ideas on how you can engage residents and stakeholders with a survey!
Happy Mapping!
And if you want to learn more about interactive mapping for community engagement, get a recording of our recent webinar on survey design!


.webp)

.jpeg)
-min.jpeg)
.jpg)


.jpeg)


.jpeg)


.jpeg)


.jpeg)
.jpeg)
.jpeg)


.jpeg)