

Struggling to increase survey response rates and the data quality in your participatory planning process? You’re not alone.
The reasons behind the struggle can be as diverse as the communities you are trying to engage. However, in our 15+ years of offering a platform for running digital community engagement, we’ve seen what most commonly leads to survey fatigue and drop-outs. The issues usually rise from poor and confusing survey design, information overload, and lack of motivation.
While surveys come in different shapes and forms and guidelines may slightly differ from one industry to another, there are best practices that proved to make a whole lot of difference in designing great surveys that help collect insightful data for participatory planning.
We’ve based this article on our decades of academic research and practical experience. It breaks the problem down to twelve best practices shown to increase response and completion rates. Additionally, we’ll provide tips, examples and tools used in thousands of surveys designed with our customers.
Before jumping to the solutions, let’s first understand the root cause of the issue. More specifically, what are the challenges in achieving a high response rate in public participation projects? Why is community engagement so challenging for many planners?
Common Challenges in Increasing Survey Response Rates

Low response rates are common roadblocks in successful community engagement. In our experience, they stem from:
- Perception of Limited Influence: Participants may feel that their input has no chance of actually influencing the final decision-making process, leading to a sense of powerlessness and disengagement. Avoid this by implementing an iterative process and create a feedback loop that allows participants to see the impact of their contribution.
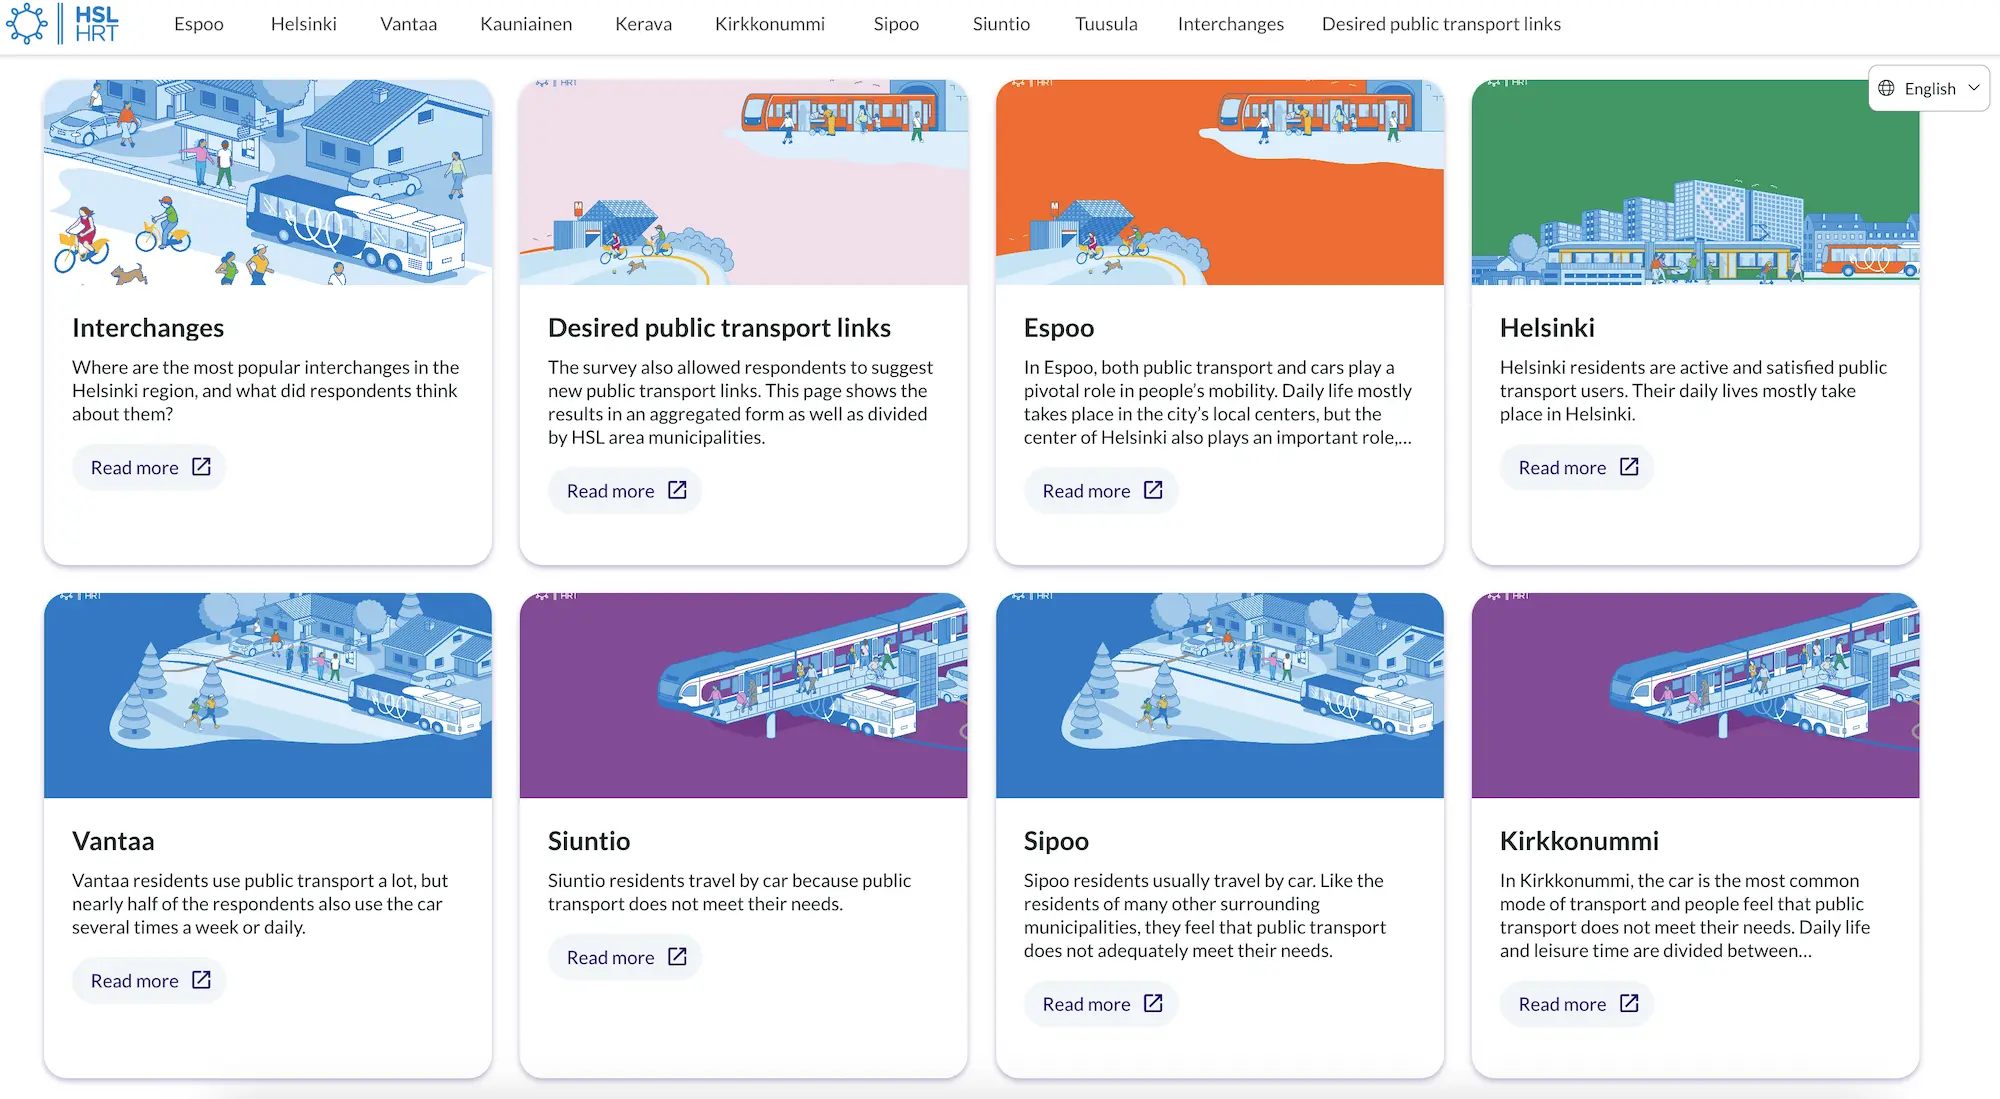
For example, the Helsinki Regional Transportation Authority (HSL) gathered survey responses from 30,000+ area residents and then used Maptionnaire's webpage builder to publicly showcase the aggregated results in multiple languages. Enabling respondents to see how their input was received and to continue the dialogue with HSL beyond the survey has been an integral part of building a reputation for "meaningful and transparent engagement".
- Lack of Trust: People may not trust the project organizers or the local authorities that they represent. They may fear that their information is not secure or that their views will be ignored.
To overcome this, work on providing a transparent and accessible environment. Tell the participants clearly what will happen with the information they share and how it will be used. Use the language they prefer to use. Make it clear that their information is anonymous and that they can request its deletion at any time. Make sure that there is at least one contact person they can reach if they have questions.
- Poor Communication: This can be either because not enough information about the project is provided in the planning process or the technical complexities are not communicated in a language accessible to everyone, regardless of their background.
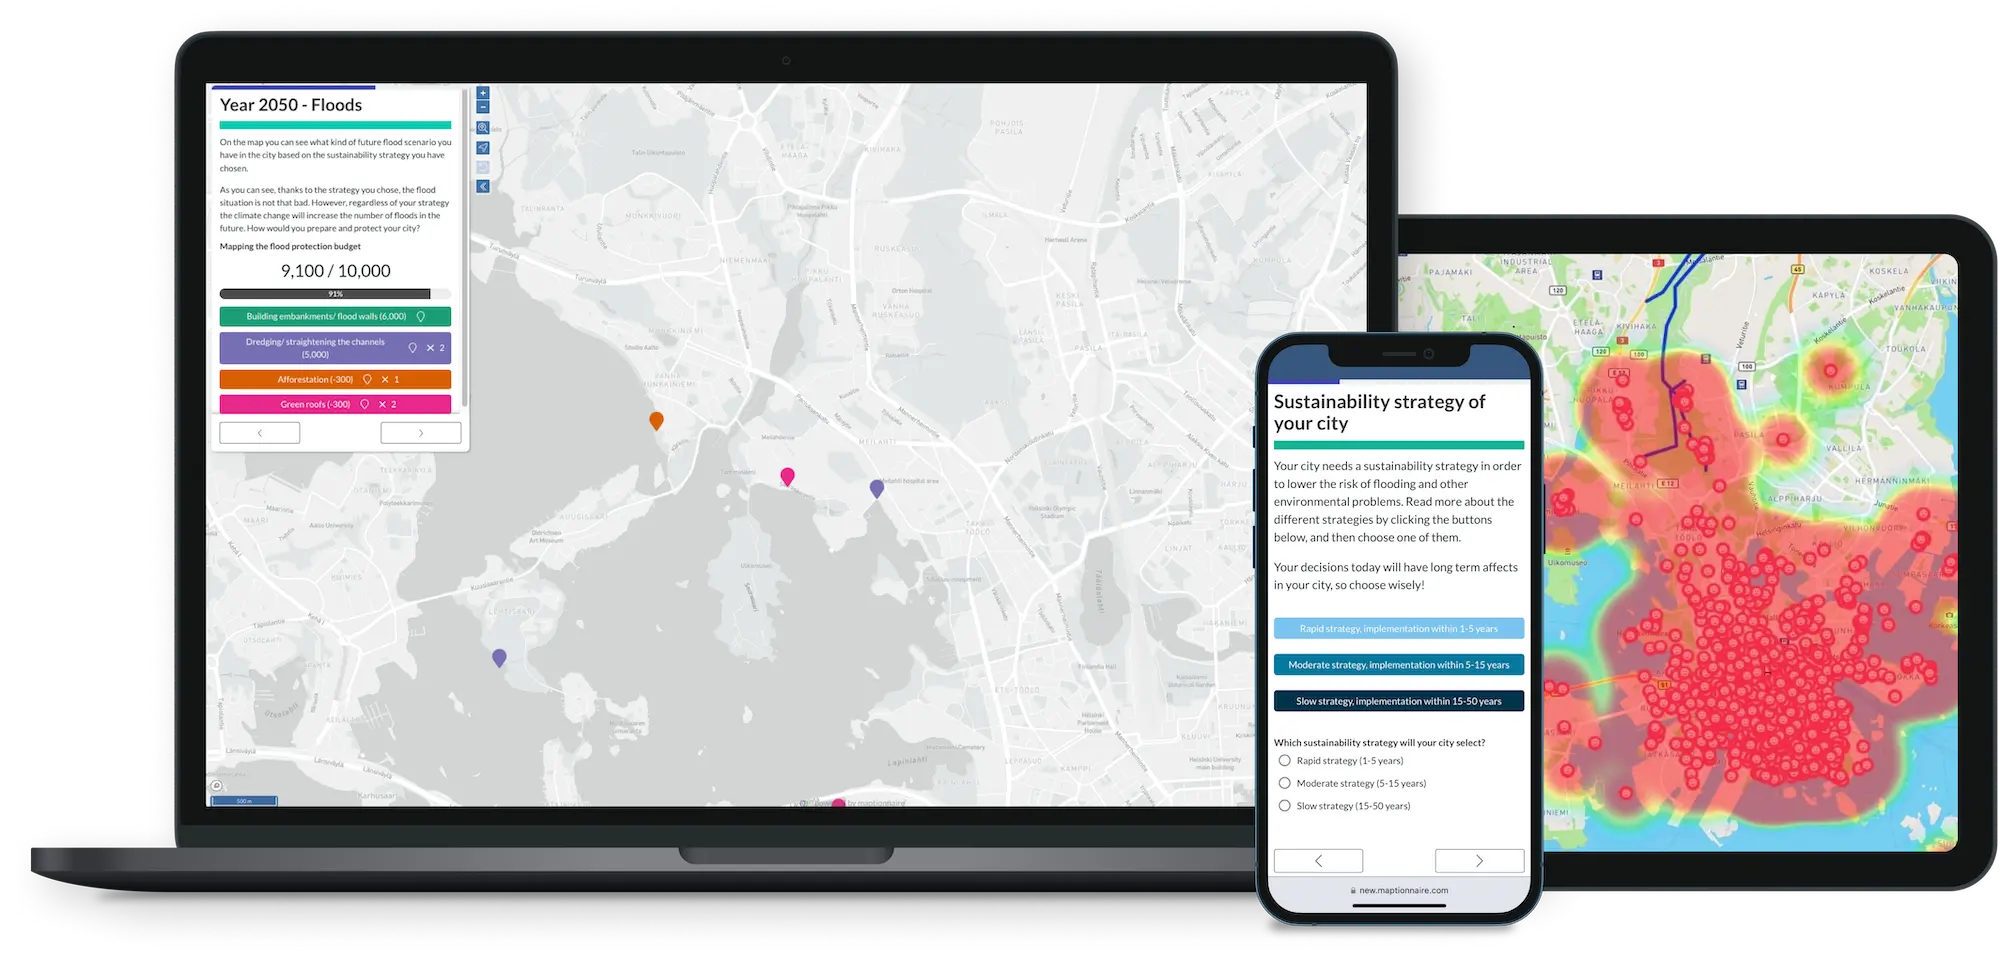
To overcome this, simplify complex information by using visuals, videos, maps or other tools at hand. Show the information on a map with for example map overlays or pop-ups.
What Makes a Good Survey?
Before getting down to the nitty gritty, let’s take a step back and remember what makes a good survey, specifically, a digital or web survey. Tools like Maptionnaire are a goldmine for community specialists, city planners, HR (human resources), and other professionals who want to collect data from diverse stakeholders.
However, while digital surveys play a crucial role in reaching a wider, more diverse audience, they can still complement in-person events like community workshops. Analyzing and reaching participants through digital channels is much more effective and easier to standardize.
So, what are the secrets to a solid survey design? A good online survey should be:
- A tool for collaborative planning
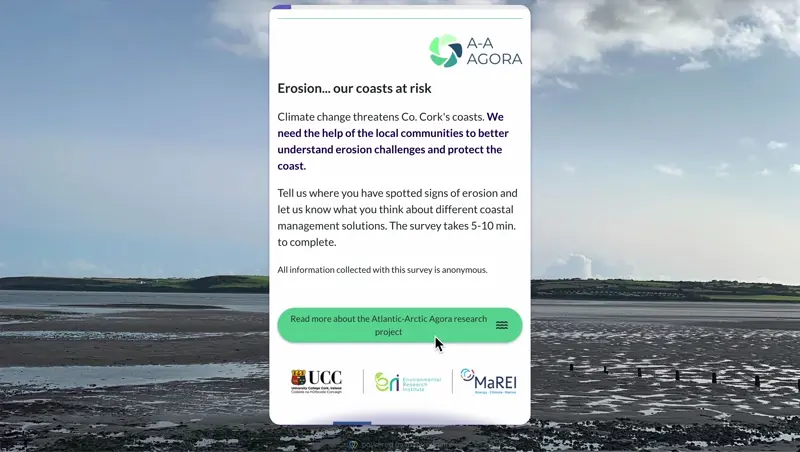
A good survey should make its goal clear from the start. You should always explain why the respondents’ input is valuable, how data will be used and communicated, and most importantly, how the outcome will impact them. This creates trust and motivates people. Having all these elements in one place is what helps you easily bring everything together.
- Concise and accessible
One of the most important factors for your completion rate is survey length. A concise interactive questionnaire helps to prevent survey fatigue. A good survey shows respect for a respondent's time by providing an estimate of how long it will take to complete. It should also be accessible on various devices, especially mobile, so respondents can answer regardless of their location.
- Actionable and visually engaging
A good survey should be designed to provide relevant data to the owner. While a mix of question types can be helpful, design choices are more impactful for driving submissions. To maintain participant focus and improve data quality, strive for simplicity. Using a single, clean background map and fewer elements per page can help respondents give more carefully considered answers. In many cases a map-based survey can be especially helpful, as you can turn a simple questionnaire into an interactive one and make the experience more enjoyable and intuitive.
- User-Centric Design
A seamless user experience is critical. While many spatial surveys require you to go back and forth between a questionnaire and a separate map, a better approach brings them together. With Maptionnaire, you can ask people to answer directly on a map by pointing to locations, creating routes, or marking down areas of interest. You can also include follow-up questions based on their answers. However, be cautious with survey design—using too many pop-ups could also increase cognitive load.
- Easy to set up and fun to answer:
No one wants to spend hours just building a questionnaire. A good survey, and in this case, a good tool to build surveys should be easy to use and exciting to answer. You want to focus on the methodology and questions rather than the technical aspects, especially when it comes to standardizing and analyzing data.
- For hybrid participation:
Even though digital platforms allow for a wider reach, the truth is that town halls and face-to-face gatherings often bring different audiences and people still yearn for meaningful connections. So, while digital surveys and online meetings are here to stay, it’s important to bring the two worlds together because they can complement each other. When thinking of your next survey, consider whether it can also be brought in a hybrid setup, to increase engagement and participation.
- For EU region, GDPR Compliant: If you’re operating in the EU or collecting data of EU residents, you have to comply with GDPR. This requires that you get explicit consent to process a person's data and that you clearly state what you will use it for. If you're in doubt, review this article on how to make GDPR compliant surveys.
Best Practices For Increasing Survey Response Rate
Now that we know the common qualities of a good survey and the typical challenges in reaching that, let’s get to the practicalities. How do you create an easy, fun and motivating survey that produces a useful dataset for planners?
Foundational Principles: Defining Your Goals and Methodology
1. Start the survey design from the end
It may sound counterintuitive, but the best way to design a survey is to start with the results you want to get. Before you write a single question, ask yourself: What specific information are you seeking, how will you use the data, and what format do you need it in (e.g., numerical, qualitative, or geolocated)? Knowing this will help you a great deal in choosing the right questions.
For example, are you interested in seeing how people answer based on their demographic profile—e.g. do you want to contrast the views of senior citizens vs. young families? If you want people to map where they go or what they would change, think about what else you need to know about the places they choose to classify them in ways that make sense from the planning perspective—for example, what is it that makes them prefer a place, how often do they visit it and with whom?
Your data needs should determine how you formulate the questions. If you don’t consider them in the drafting stage, the chances are you end up with a dataset that needs some cumbersome processing before it can be used.
Thinking about how you’ll process the response data will also help you figure out what question format to choose. For example, it is a good idea to ask for a person’s email and phone number in separate fields rather than in one open field so that you get a neat list without any need for data clean-up. When you need an in-depth answer, use an open text question. Similarly, if you want to classify responses by respondents’ age, have them choose an age group from a list rather than type their age themselves.
2. Motivate respondents to participate
Step into the shoes of your respondents: who are they and why should they participate?
Why should a busy community member give 15 minutes of their precious time to answer your survey? Outline your goals and why it’s important that they answer. Tell them how the data will help planners—for example, in deciding what facilities a park will have, where new trails will be built, or where measures will be implemented to make traffic safer. How can answering this survey make the respondent’s life in the community better? Provide this information on the first page of the survey, but keep it clear.
Think also about who it is that you want to reach, and what can be different obstacles and motivators for them. For example, busy moms might not have time to follow what’s going on in the local planning scene—design your marketing campaign to include social media ads in local online groups, and bring flyers with QR codes to playgrounds. Think about what language groups the community includes— our built-in AI translator makes it easy to create translations.
3. Apply a clear structure
By now you should know your data needs and goals. This determines what questions you will ask and what question elements you’ll use to ask them. Think about if the questions can be divided into themes or sections. For example, the first section will focus on residents’ current daily habits and needs. The second section will focus more on asking respondents to map where they’d place new facilities or services and allocate resources.
You can share this structure on the introductory page, and let them know during the survey when they have reached the next section – so, guide them through the survey. Keep motivating them by letting them know how close they are to completion.
Reaching a Wider Audience: Fostering Inclusive Community Engagement
Inclusive community engagement is not a buzzword—it's a best practice for facilitating transparent, democratic, and collaborative planning processes with community input. Reaching a wider, more diverse audience will not only provide more representative data but can also help to increase your response rate.
4. Shorter is (almost) always better
The shorter your survey, the better your completion rate. For example, Salminen et al (2025) found that the majority of respondents are willing to spend 15 minutes max on a survey. This does not mean that you need to compromise on the quality—what’s usually needed is merging similar questions and thoroughly outlining what you need as explained in step #1.
Maptionnaire provides multiple ways to help you simplify your survey. Show each respondent only the questions that are relevant for them by employing the branching logic feature—for example, if some questions are only for the local business owners, hide them from the others. Use location zoom to help respondents find their neighborhood on the map.
If you need to provide a long wall of text that goes into the details, place it behind a pop-up button or provide it as a downloadable PDF doc so those who are interested can find it but you’re not overloading the rest. Provide “breadcrumbs” (e.g. text saying that they’re almost done with the survey) throughout the survey.
Tell respondents the approximate time that it will take to answer the survey and that they don’t need to complete the survey in one go (responses are saved immediately and the browser session saved in our system). Don’t set the questions to be mandatory, it generally frustrates people and makes them more likely to quit.
5. Use visual communication
Avoid survey fatigue by using visual communication methods whenever possible. Maptionnaire provides various ways of doing this:
- Use images (PNG, SVG, JPG…) and videos (Youtube/Vimeo) to explain concepts and plans
- Make the survey interesting by adding striking photos and illustrations
- Customize the survey according to your brand identity
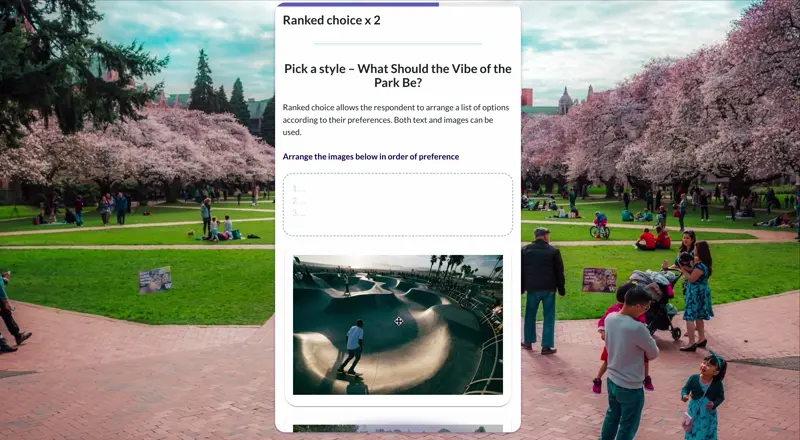
- Include images as part of questions—e.g. a multiple choice question can be asked with images or icons as the response options
- Add images onto maps as GeoTIFFs or by georeferencing them directly in Maptionnaire
- Choose maps in different styles and apply visual effects to shapefile features
- Make maps truly interactive with the pop-up map feature—when a feature on the map is clicked, a picture or video of it opens.
6. Ensure accessibility
The tool that you use for your survey should be compliant with accessibility directives. Since accessibility is important at Maptionnaire, we are committed to adhering to the Web Content Accessibility Guidelines (WCAG), which form the basis for both ADA and EU legislation on digital accessibility. We’ve undergone testing by a third party and received AA-rating (on the WCAG 2.1 scale). Read more about our accessibility compliance here.
This does not mean that you don’t need to pay attention to accessibility when building your survey. Luckily, we’ve provided many ways in which you can easily ensure accessibility. For example, you can include alternative descriptions (alt-text) for images, and direct screen-reader users to bypass mapping portions and direct them to alternative questions. You can enable responding via video or audio messages, and include spoken-word audio clips of questions.
7. Engage diverse communities.
For a survey to truly be inclusive, it must be accessible to everyone in your target audience. A key way to achieve this is by providing your survey and all related communications in the languages your audience speaks. When you do, you'll often see a significant increase in response rates, as it shows respect for participants and removes a major barrier to participation.
This is a huge advantage of using Maptionnaire. The platform enables you to easily translate surveys and project pages into multiple languages, with no manual, burdensome work. By making your project multilingual, you can engage a wider, more diverse community and ensure your data is as inclusive as possible.
Execution: Crafting and Delivering the Survey
8. Avoid jargon and bureaucratic language
If you are asking for the public opinion, you should use the language the public is familiar with. Use plain English and add visuals to explain the project and its core concepts.
Consider checking how difficult it is to understand a text in your survey with e.g. the Flesch-Kincaid readability test. Aim for the 8th or 9th-grade readability level, but always have your audience in mind.
9. Ask clear and simple questions
A common mistake is to ask several things within one question (e.g., “Are the houses beautiful and their surroundings well-maintained?”). Avoid questions that can be understood in many ways, such as: “Where do you typically come to this area from?” In this case respondents might wonder if you mean the place their trip originates from (work or home), which entry point they use, or which route they use.
Community engagement platforms and survey tools offer dozens of survey question types. It’s often hard to understand which question type will yield the best result. If in doubt, check our comprehensive guide on designing community engagement survey questions.
10. Use open questions strategically
An open question asks respondents to write their answer in their own words. It can help you dig deeper and provide valuable insights, but can equally lead to survey fatigue and increased drop-off rates. Textual data can also easily increase the workload during the analysis stage. Always consider if an open text question would make more sense as a multiple-choice question (or another question type).
However, many times an open text answer can be just what’s needed. When it comes to analyzing collected data, Maptionnaire comes with built-in AI capabilities that can significantly reduce your workload in analyzing written data and provide great insights which otherwise you might miss. What’s more, it provides highly visual reports to showcase findings and outcomes to all stakeholders.
There’s a wealth of information into GIS and map-based community engagement. For a better understanding of when to use spatial surveys, we have a dedicated article on the topic.
11. Provide clear instructions
Respondents may sometimes face technical issues, especially with map-based questions. It’s a good idea to add instructions on how to use the survey tool.
Also, consider the phrasing of your instructions: instead of using technical terms such as “point”, “line”, and “polygon”, you could use “place”, “route”, and “area” to better describe what you wish the respondents to answer.
In a participatory mapping survey for a Green Belt project, leaders did a fantastic job at explaining the survey mechanics. They’ve added a test round and a video explainer.
12. Always test, test, test!
Always test your survey: does it flow smoothly? Are the questions arranged in a logical way? Also, take a look at the data you get in your results file. Is it categorized the way you imagined? The best way to test a survey is to gather a group of voluntary testers who are in your target group.
Choosing the Right Tool for Survey Design
You’ve seen that a great survey is more than just a list of questions—it’s a powerful tool for community engagement. It’s concise, easy to answer, and provides actionable data.
Putting these principles into practice requires a platform that’s up to the task. Maptionnaire is designed for exactly that. It offers an extensive toolkit for streamlining collaborative design, enhancing data collection from diverse stakeholders, and creating a truly interactive experience. You can move beyond traditional questionnaires and use engaging visuals and map-based questions to get richer, more valuable insights from your community.
.png)


.png)

.webp)


.webp)

-min.webp)
.webp)
.webp)


.webp)


.webp)


.webp)


.webp)
.webp)
.webp)


.webp)


