

Green Belt is a longstanding, but contentious planning policy in England due to the public's attachment to its open spaces and the need for development. But despite the heated debates, no one fully knows the value these green areas bring beyond urban containment. How do residents actually use these spaces, and what benefits do they provide?
Read on about a participatory mapping project that ventures to understand and measure the diverse cultural and social values of the Green Belt. This mapping survey is a part of Matt Kirby’s PhD research on Multifunctional Green Belts at Northumbria University. His research is sponsored by ONE Planet Doctoral Training Program. If you want to get in touch with Matt, use matt.kirby@northumbria.ac.uk. You can follow his research output here.
What are Green Belts in England?
Green Belts take 12,4% of England’s total land area. These green hubs encircle major urban clusters in order to contain urban development, prevent cities from expanding into the countryside and rural areas, and preserve open landscapes. It is generally prohibited to develop the land within the belt unless you prove exceptional circumstances.
Although being in place for more than half a century, the policy has had little alteration since. Meaning this policy doesn’t fully take into account the current uses of the Green Belts nor the contemporary needs of land use.
Hence Green Belts are the reason for many planning and policy-level discords. While some argue that the policy succeeds in preventing urban sprawl and encourages urban regeneration (that is, more effective development of existing urban areas as opposed to developing new areas), others propose wider uses for these zones. Housing would be a priority, given the current housing crisis in the UK. At the same time, it’s possible to develop some of these areas into multifunctional spaces, which deliver environmental and social benefits.
Despite the Green Belts being the center of attention for so long, there is very little understanding of how people actually use these spaces. There is occasional anecdotal evidence about their societal and cultural functions but no substantial knowledge exists about what the Green Belt is for local communities, how they use it and the benefit they get.
Understanding the Secondary Values of the Green Belts
Matt Kirby’s research aims at filling exactly this gap — what is a Green Belt beyond an urban containment policy? What are the secondary benefits that rarely make it into a policy description?
Looking at these spaces from the natural capital perspective, Matt defines three types of services the Green Belts offer:
- provisioning services (agriculture, timber),
- regulating services (flood regulation, carbon storage),
- cultural services (sense of place, recreation, wellbeing).
Uniquely, Matt quantifies these benefits. He uses established model-based approaches for analyzing provisioning and regulating services — but when it comes to cultural benefits, more innovative and participatory approaches are required.

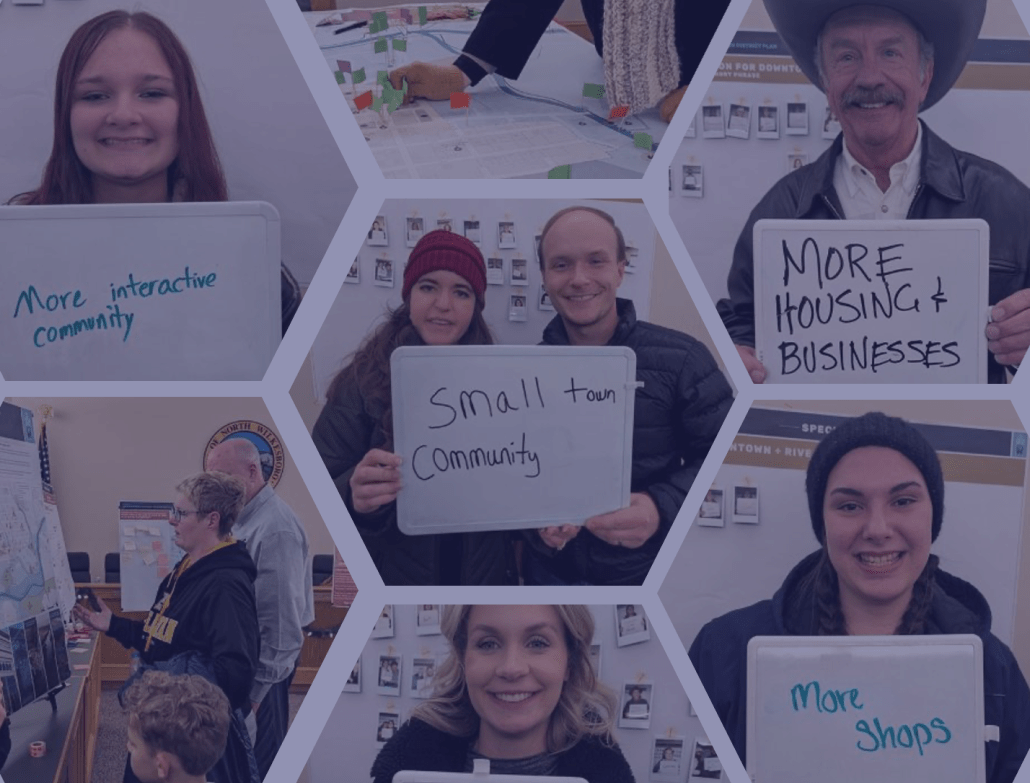
Participatory Mapping for Studying the Use of Green Spaces
How do you understand how people use a certain space? Participatory mapping is the most suitable approach that allows you to map, quantify, and understand cultural or other intangible benefits of spaces at scale.
In other words, it helps you gather the soft data in GIS format and analyze it. Tightly related to PPGIS (public participation GIS), this approach is widely used in Finland and other Nordic countries, while not yet as established as a research method in the UK.
👀 Want to know more about PPGIS? Here are the cons and pros the PPGIS method brings to urban planning.
To understand the uses of the Green Belts, Matt turned to the Maptionnaire Community Engagement Platform born out of a research project focused on participatory mapping. The platform enables respondents to mark specific places in a map-based survey and report any kind of additional information — why they use (or don’t use) the space, what benefits it brings, and what they like or dislike about it. While often used in the research context, Maptionnaire is especially valued by urban planners, cities, and consultancies.
Designing a Participatory Mapping Survey

The main engine of participatory mapping is a digital map-based survey. For his research, Matt surveyed the residents neighboring the North-East Green Belt (also known as Tyne & Wear), asking them a series of map-based questions — for example, pointing out the last place they’ve visited in the Green Belt and places they want to go, but do not.
Once the pin is placed on a digital map, a respondent is prompted to answer follow-up questions about the qualities of their visit, such as what kind of activities they’ve done, how frequently they visit this space, and with whom. Other questions focused on identifying negative places and prioritizing the functions that the Green Belt offers, closing with a standard demographic survey.
In the survey design process, the main conundrum is around asking the right questions to get valuable data without making the survey too long. This questionnaire only collected point data (although you can ask respondents to answer by drawing a point, a line, or a polygon on a digital map).
This way, it was easier for residents, making the analysis more straightforward along the way. On the other hand, it is not as easy to mark a walk or a big area with a point and not a line or a polygon. It’s always a trade-off!

Tips on Survey Outreach
The survey attracted more than 770 respondents generating 2500 location-based answers, which is a great result (the threshold was around 500). When it comes to representativeness, Matt is quite happy as it correlates well with the recent census data when it comes to, for example, age and income level. There are slightly more female respondents but it is an inherent trait of volunteer-based sampling.
Matt shares with you his playbook for designing an outreach strategy.
- Spread the word about the survey via local social media groups. In his case, Matt made sure to get an even distribution across the communities neighboring the Green Belt to avoid oversampling and spatial bias.
- Visit local schools lessons to get younger respondents – they are often underrepresented in engagement results.
- Include a link to the survey in email lists through key stakeholders.
- Encourage participation by distributing physical posters with a QR code to the survey (every Maptionnaire survey comes with a QR code).
- For monitoring results on the fly, the in-app analytics tools are useful — with graphs and map visualizations, Matt could quickly estimate the sampling size and the demographics and how much data is collected.
Analyzing Participatory Mapping Results
At this point, Matt is working on a spatial and statistical analysis of the survey results. He exports the data in a desired format and feeds it into statistical and GIS software.
There, he identifies hotspots for both the most visited places and underused areas and collates them with various other spatial layers to contextualize where people go and what sort of places provide what benefits. Due to the rich background information collected with the Maptionnaire survey, it’s possible to identify why certain places are underused or vice versa.
For example, while comparing datasets, Matt has discovered that the usage of the Green Belt tightly correlates with the public right of way — a set of routes through which anyone can go through the land, even if privately owned, at any time. So it is an important factor for people to use the Green Belt that should be accounted for in future policy work.
Next, Matt will dive into statistical modeling to distinguish various scenarios for the Green Belt as well as compare trade-offs spatially with the regulating and provisioning services provided.

All of this data on locals using the Green Belt is crucial for supporting current policy and our knowledge on how people use the countryside around their towns and cities. If we are to develop these areas, can we develop them in a way that people will positively benefit from?
Since planning is an evidence-based and data-driven process, it cannot rely on anecdotal evidence. And finally, since there is solid data about the cultural and societal benefits of the Green Belt, these human experiences and motivations can tangibly influence policy and be incorporated into decision-making.
TL;DR
- Participatory mapping is a solid method for understanding the diverse values that urban and rural spaces bring to the locals. Maptionnaire offers a map-based platform for running a participatory mapping process and generating highly usable data.
- In this case, Matt Kirby used Maptionnaire for analyzing the place-based cultural values of the Green Belt. This data and his research findings in general will be essential for understanding the Green Belts as multifunctional spaces that provide services beyond urban containment and, subsequently, for informing the long-overdue policy changes.


.jpeg)
.webp)

.webp)


.webp)
.png)


